Project Description
Low-Income Students Becoming Majority, Fair Funding Needed
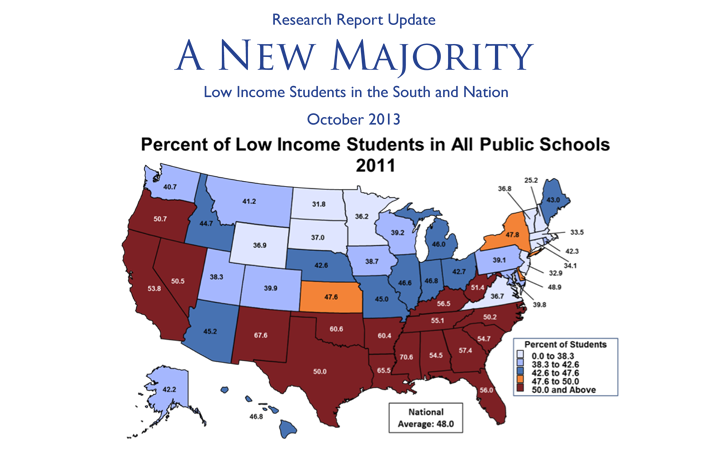
A report released recently by the Southern Education Foundation (SEF), “A New Majority: Low Income Students in the South and the Nation,” finds that low-income children are a majority of students in 17 states, primarily in the South and West, and a near majority of all students across the nation (48 percent). A separate report, “Is School Funding Fair? A “National Report Card,” analyses the school funding systems in these 17 states and finds serious cause for concern.
Many low-income students are not given the opportunity to achieve academically due to inadequate funding of essential resources in their schools. The SEF report warns: “Without fundamental improvements in how the South and the Nation educate low income students, the trends that this report documents will ricochet across all aspects of American society for generations to come.”
The report finds
- Over the last ten years, the number of low-income students has grown at a rate three to four times greater than the growth of per pupil expenditures in three of the four regions of the country.
- During the last decade, while achievement scores have increased for both low-income and higher income students, huge gaps still remain between these two student groups, particularly in regions where less money is spent on public education.
- The achievement gap between low-income and higher income students is as large or larger in private schools as it is in public schools.
- Within the next few years, it is likely that low-income students will become a majority of all public school children in the United States.
- The report concludes that this trend raises the prospect of “entrenched, inadequately funded educational systems that enlarge the division in America between haves and have-nots.”
TIs School Funding Fair?
How well do the 17 states where over 50 percent of the student population is low-income fund their schools? The National Report Card, the best analysis of school funding available, rates all 50 states on four separate and interrelated “fairness indicators,” including funding distribution, funding level, and state fiscal effort. The Report Card is built on the principle that predictable, stable and equitable state systems of school finance are the essential precondition for the delivery of a high-quality education.
Funding Distribution
Fair school funding requires that districts with more low-income students receive greater resources in order to provide their students with the opportunity to learn. The National Report Card identifies whether states have “progressive”, “regressive”, or “flat” school funding systems and assigns grades from A to F. A progressive system delivers a higher level of resources to higher poverty districts.
Some of the 17 majority low-income states are doing well at progressively distributing state and local resources to school districts. Louisiana, Georgia, Tennessee, Kentucky, and California receive A’s, while Arkansas, New Mexico and Florida receive B’s.
On the other hand, some states are regressive, meaning that high poverty districts receive fewer resources than low poverty districts. In Alabama, Texas, North Carolina and Nevada the funding systems are regressive. In North Carolina and Texas, the two worst states, high poverty districts have only 70 percent of the funding in low poverty districts. In other words, despite their students’ higher needs, they have only 70 cents to spend for every dollar that wealthier districts spend.
Funding Level
The Report Card ranks states using per pupil funding data that is adjusted to take into account the different contexts within each state — for example, poverty levels, labor market conditions, and district configuration. All states but one (West Virginia) of the 17 majority low-income states are in the bottom half when ranked by funding levels. Tennessee, Mississippi, and Oklahoma, the lowest funded among the 17, provide fewer than $7,500 dollars per pupil compared to a national average of about $10,400.
Effort
Many of these states are also low-effort states, as measured by the amount of the state’s economic productivity dedicated to funding schools. The Report Card grades states from A to F on this measure. Florida, Nevada, California, North Carolina, Tennessee, Louisiana, and Oregon all receive F’s. A few of the majority low-income states have relatively high effort levels, namely West Virginia, Arkansas, and South Carolina. However, these three states have among the lowest levels of economic capacity in the nation, so even a high effort produces relatively low overall funding levels.
While the U.S. continues to lead the developed world with the highest student poverty rates, the National Report Card shows that many states have not adopted school funding systems that enable schools to provide high quality educational opportunities to millions of low-income children.
The SEF’s recent release updates a 2007 report, A New Majority: Low Income Students in the South’s Public Schools, which documented the fact that low-income students had become a majority in the South’s public schools for the first time in more than four decades.
The third edition of “Is School Funding Fair: A National Report Card” will be available on the report’s website in December 2013.
Education Justice Press Contact:
Molly A. Hunter, Esq.
Director, Education Justice
email: mhunter@edlawcenter.org
voice: 973 624-1815 x19
www.edlawcenter.org
www.educationjustice.org
Copyright © 2013 Education Law Center. All Rights Reserved.