Project Description
ABOUT BBA
ABOUT THE AUTHORS
Don Long has been a consultant for BBA since November 2011. In that capacity, he has conducted research, drafted and edited documents, and identified much of the evidence for this report. Prior to working as an independent education consultant in Virginia, Long was director of the State Collaborative on Assessment and Student Standards (SCASS) and program manager at Pearson Educational Measurement in Austin, Texas. Long has a Master of Public Affairs degree from the LBJ School of Public Policy at the University of Texas, Austin.
KEY FINDINGS
- Test scores increased less, and achievement gaps grew more, in “reform” cities than in other urban districts.
- Reported successes for targeted students evaporated upon closer examination.
- Test-based accountability prompted churn that thinned the ranks of experienced teachers, but not necessarily bad teachers.
- School closures did not send students to better schools or save school districts money.
- Charter schools further disrupted the districts while providing mixed benefits, particularly for the highest-needs students.
- Emphasis on the widely touted market-oriented reforms drew attention and resources from initiatives with greater promise.
- The reforms missed a critical factor driving achievement gaps: the influence of poverty on academic performance. Real, sustained change requires strategies that are more realistic, patient, and multipronged.
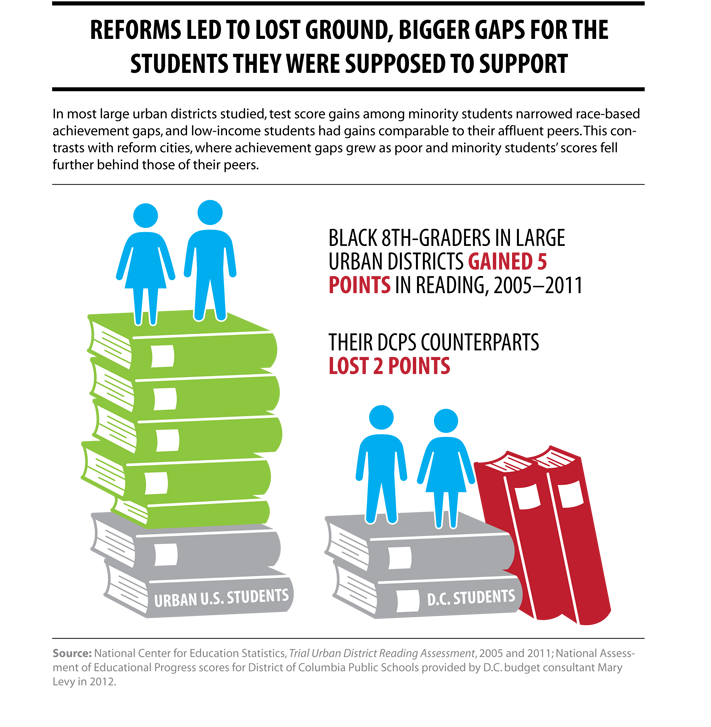
- Between 2005 and 2011, in large, urban districts, Hispanic eighth-graders gained six points in reading (from 243 to 249), black eighth-graders gained 5 points (from 240 to 245), and white eighth-graders gained 3 points (from 270 to 273).1 In District of Columbia Public Schools, however, Hispanic eighth-graders’ scores fell 15 points (from 247 to 232), black eighth-graders’ scores fell 2 points (from 233 to 231), and white eighth-graders’ scores fell 13 points (from 303 to
290).2
- New York City ranked second to last among 10 large, urban districts in NAEP test score gains from 2003 to 2011 (averaged across fourth and eighth grade reading and math).3 New York City students gained 4.3 points, half the urban district average gain of 8.8 points.4 Only Cleveland students had a smaller average gain (1 point).
- In Chicago Public Schools (CPS), white and Asian students made modest gains in reading between 2003 and 2009, but Hispanic students gained little and black students gained nothing, so achievement gaps between white and minority students grew at both the fourth and eighth grade levels, as measured by NAEP scores. Nationally, race-based achievement gaps in reading narrowed considerably among fourth-graders and remained about the same among eighth-graders.5
While test scores increased and achievement gaps shrank in most large urban districts over the past decade, scores stagnated for low-income and minority students and/or achievement gaps widened in the reform cities.
- As Washington, D.C., schools chancellor, Michelle Rhee announced that all subgroups of students had improved their reading and math scores between 2007 and 2010, with low-income and minority high school students posting double-digit gains in “proficiency.”6 But those gains, based on an arbitrary DC Comprehensive Assessment System “proficiency” level, were illusory. NAEP scores showed minimal-to-no improvement for low-income and minority students, and some losses. Moreover, higher scores were due in most cases not to actual improvements for any group, but to an influx of wealthier students. For example, average fourth-grade NAEP reading scores rose from 198 to 201, or by 1.5 percent, from 2007 to 2011. But during that period, scores for white and Hispanic students fell by 3 points, and black students’ scores stagnated, so only new students who brought higher scores to the pool could account for the small overall gain.7
- New York City Mayor Michael Bloomberg claimed to halve the white/Asian to black/Latino achievement gap in city schools from 2003 to 2011, but scores on state-administered tests, averaged across fourth and eighth grades in reading and math, show that the achievement gap had stagnated; it was 26.2 percentage points in 2003, versus 25.8 percentage points in 2011 (a 0.01 standard deviation change). Columbia University professor Aaron Pallas, who calculated the 1 percent reduction, noted, “The mayor has thus overstated the cut in the achievement gap by a factor of 50″.8
The mayor has thus overstated the cut in the achievement gap by a factor of 50.
- President Obama and Education Secretary Arne Duncan (when he was CPS CEO) have both cited large increases in elementary school reading ”proficiency” of 29 percentage points—from 38 percent of students in 2001 to 67 per- cent in 2008. CPS used these figures in January 2009 brochures. When scores were adjusted for changes in tests and procedures, however, the percentage of elementary and middle-school students deemed proficient (“at or above grade level”) had grown by about 8 percentage points, while the percentage of proficient high school students had grown only a point and a half.9
Test-based accountability prompted churn that thinned the ranks of experienced teachers, but not necessarily bad teachers.
Reformers said that using student test scores to evaluate teachers, to reward and
fire teachers, and to target schools for closure, would improve the quality of teachers in low-income schools. The report finds, rather, that narrow, unreliable metrics turned off great teachers, increased churn, and drained experience from teacher pools, with no boost to student achievement.
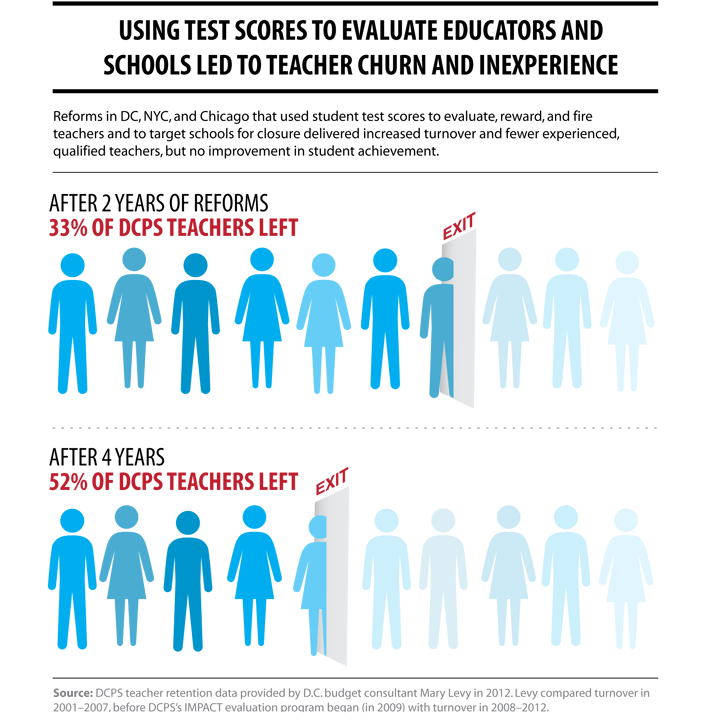
- District of Columbia Public Schools’ IMPACT system, which bases teacher evaluations (and dismissals) heavily on test scores, is associated with higher teacher turnover. The share of DCPS teachers leaving after one year increased from 15.3 percent in 2001–2007 (before IMPACT began in 2009) to 19.3 percent in 2008–2012; the share leaving after two years increased from 27.8 percent to 33.2 percent; the share leaving after three years increased from 37.5 percent to 42.7 percent; and after four years fully half (52.1 percent) of teachers left the system, up from 45.3 percent.10 Few teachers reach “experienced” status, generally considered at least five years and, by some experts, seven years or more.
- New York City spent $50 million from 2007 to 2010 on awards to teachers who substantially raised test scores in high-needs schools. In 2011, it ended the program after a RAND study con- firmed “mounting evidence that all those bonuses weren’t having much of an effect.”11 The Schoolwide Performance Bonus Program, intended to “motivate educators to change their practices to ones better able to improve student achievement” failed to improve student achievement at any grade level, school progress report scores, or teachers’ reported attitudes and behaviors.12
- CPS used test scores to close “failing” schools, forcing out many experienced teachers. CPS also laid off 1,300 teachers from 2001 to 2008, citing budget shortages. The district never provided teachers due process hearings, and in 2010, a group of teachers, including 749 who had tenure, won a discrimination suit.
New York City spent $50 million from 2007 to 2010 on awards to teachers who substantially raised test scores in high-needs schools. In 2011, it ended the program after a RAND study confirmed ‘mounting evidence that all those bonuses weren’t having much of an effect.
They had alleged that they had been replaced with less experienced, younger, whiter teachers. The judge held that CPS had violated their rights and ordered the district to work with the union to recall them, noting that most had not received unsatisfactory reviews.13
- DCPS’s initial reported cost of $9.7 million to close 23 underenrolled schools in
2008 grew to $39.5 million, with added moving expenses, demolitions, patrols,
new transport costs, and others quadrupling the pricetag.14 - Michelle Rhee had also noted that students in the schools slated for closure were struggling, but the students went, on average, to schools with lower test scores and lower odds of making “ad- equate yearly progress” (AYP).15
- Between 2002 and early 2012, the NYC Department of Education closed 140 schools, all of which served the students with the highest needs.16 About 15 percent of those were large, comprehensive public high schools that were broken up into smaller, themed schools. Most of the students who would have attended the closed high schools were not admitted to the smaller schools but went to other large comprehensive high schools, “which consequently became academically overwhelmed, making them additional targets for closure.”17 Of 34 large Brooklyn, Manhattan, and Bronx high schools, 26 significantly increased enrollments—by 150 to more than 1,100 students—as other high schools were closed from 2002 to 2007. In 19 of these 26 schools, attendance declined; in 15, graduation rates declined, and in 14, both attendance and graduation rates declined.18
Most of the students who would have attended the closed (NYC) high schools were not admitted to the smaller schools but went to other large comprehen- sive high schools, ‘which consequently became academically overwhelmed, making them additional targets for closure.
- Although Arne Duncan closed Chicago public schools deemed “underperforming” in order to move students to better schools, the closings had almost no effect on student achievement because almost all displaced elementary school students transferred from one low-performing school to another, according to a study of 18 schools closed between 2001 and 2006. Only the 6 percent who moved to better schools with greater resources had improved outcomes.1
- Rhee transferred operations of two DCPS high schools and one elementary school to outside charter organizers. None of the three schools improved their performance under new charter management, and both high schools have since been reconstituted again for very poor performance.21 Overall, charters in Washington, D.C., seem to slightly outperform regular neighborhood schools, but they serve fewer high-needs students.
- Two widely cited reports found most students benefited significantly by at- tending NYC charter schools rather than regular district schools, but two other reports questioned those reports’ methodologies and findings. It is clear, however, that New York City charters benefit from more funding per student and better facilities in co-located spaces. While they serve more minority and low-income students, they serve fewer students who are special needs, very poor, or English language learners (ELL), and these high-needs students are costlier to serve. Comparing charters with nearby public schools illustrates stark differences. At Samuel Stern public school, where 86 percent of students qualify for free lunch and 19 percent are ELL, per-pupil spending is $12,476. At nearby Harlem Day charter school, 62 percent of students qualify for free lunch, and there are no ELL students, but per-pupil spending is $19,632.22
- The Chicago Public School system uses its own “value-added” metric to measure school performance, with schools scoring lower on the distribution identified for closure. By this mea- sure, if students in the types of schools most likely to be closed moved to charters, they would move to lower-performing schools. Specifically, students who moved from high-poverty regular public schools at the 47th percentile in performance would go to charter schools at the 40th percentile, and those moving from intensely segregated schools at the 43rd percentile would end up in charters at the 33rd percentile. Random-lottery enrollment schools, which, unlike charter schools, do not “select out” students via a challenging application process, outperform their demographically comparable charter counter- parts: Students who moved to charters would drop from the 52nd percentile to the 40th percentile.23
If students in the types of schools most likely to be closed moved to charters, they would move to low- er-performing schools.
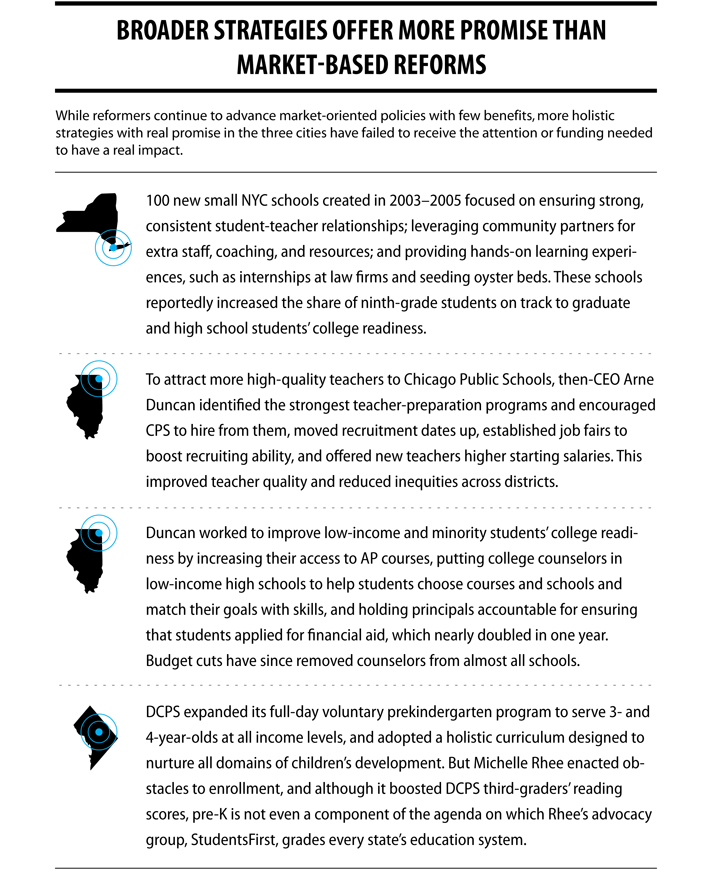
These promising but over- looked reforms are more multifaceted and holistic than those that seek quick fixes and rely on narrow, unreliable metrics.
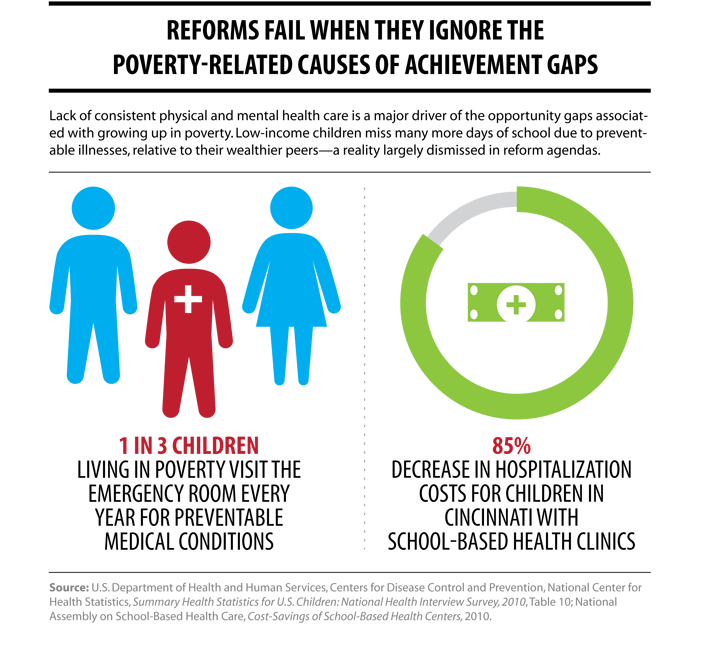
In all three cities, a narrow focus on market-oriented policies diverted attention from the need to address socioeconomic factors that impede learning. In 2010, student eligibility rates for free- and reduced-price meals were 67 percent in Washington, D.C., 72 per- cent in New York City, and 77 percent in Chicago.27 Failing to provide supports that alleviate impediments to learning posed by poverty ensures continued low student test scores and graduation rates, and large gaps between average scores of white and affluent students and scores of minority and low-income students.
Districts that recognize the impact of poverty and address it head-on find the greatest success. Though it is higher-income, Montgomery County, Md., serves a student body that is as ethnically diverse as any of these urban districts, and has a large and growing share of low-income students. In contrast to the reformers, however, Montgomery County Public Schools (MCPS) Superintendent Joshua Starr staunchly opposes using test scores to evaluate teachers, instead employing a peer-assisted review system that focuses on teacher support, development, and collaboration.28
MCPS has no charter schools. Rather, it channels extra resources, including targeted professional development for qualified teachers, smaller classrooms, and intensive literacy, to the neediest schools. It has developed a holistic, creative curriculum to nurture in-depth, critical thinking. This includes art, music, and physical education teachers in every school. MCPS also leverages the county’s mixed-use housing policies to integrate schools.29 Finally, it employs high-quality prekindergarten, health clinics, and afterschool enrichment to further close income-based opportunity gaps. As Starr highlights, all of this has produced some of the highest test scores among minority and low-income students of any district, smaller and shrinking achievement gaps, and high school graduation and college attendance rates that are the envy of the country.30
Every school district has unique needs and resources. But providing all students with the enriching experiences that already help high-income students thrive would represent a big step forward, and away from narrow reforms that miss the mark.
Endnotes
1. National Center for Education Statistics, 2005 Trial Urban District Reading Assessment, 2005; http://nces.ed.gov/pubsearch/pubsin- fo.asp?pubid=2006455rev; National Center for Education Statistics, 2011 Trial Urban District Reading Assessment, http://nces.ed.gov/ nationsreportcard/pubs/dst2011/2012455.asp
2. Mary Levy, “DCPS NAEP, 2003–2011”
3. The 10 districts studied were the 10 urban districts that participated in the Trial Urban District Assessment (TUDA) in 2003. By 2011, there were 21 TUDA districts.
4. Leonie Haimson, NYC Achievement Gains Compared to Other Large Cities Since 2003, Class Size Matters, 2012; http://www.class- sizematters.org/nyc-second-to-last-among-cities-in-student-progress-on-the-naeps-since-2003/
5. Stuart Luppescu, Elaine M. Allensworth, Paul Moore, Marisa de la Torre, James Murphy, and Sanja Jagesic, Trends in Chicago’s Schools Across Three Eras of Reform, Consortium on Chicago School Research at the University of Chicago Urban Education Institute, 2011; http://ccsr.uchicago.edu/sites/default/files/publications/Trends_CPS_Full_Report.pdf
6. District of Columbia Public Schools, DCPS on the Move: Three-Year Growth and Trends, 2010; http://dcps.dc.gov/DCPS/Files/down- loads/ABOUT%20DCPS/Press/DCPS-Press-Release-DCPS-On-the-Move.pdf
7. Levy, “DCPS NAEP, 2003–2011.”
8. Aaron Pallas, “The Emperor’s New Close,” GothamSchools, March 7, 2012; http://gothamschools.org/2012/03/07/the-emperors-new- close/#more-78849
9. Civic Committee of the Commercial Club of Chicago, Still Left Behind: Student Learning in Chicago’s Public Schools, 2009; http://civic- committee.org/initiatives/education/Still%20Left%20Behind%20v2.pdf
10. Mary Levy, “Teacher Retention, 2001–2012” [unpublished Excel files provided by D.C. budget consultant Mary Levy in 2012, assembled from D.C. Public Schools’ employee lists provided to the D.C. Council during the budget process].
11. Sarah D. Sparks, “Study Leads to End of New York City Merit-Pay Program.” Education Week Inside School Research (blog), July 20, 2011; http://blogs.edweek.org/edweek/inside-school-research/2011/07/a_new_study_by_the.html
12. Julie A. Marsh, Matthew G. Springer, Daniel F. McCaffrey, Kun Yuan, Scott Epstein, Julia Koppich, Nidhi Kalra, Catherine DiMartino, and Art (Xiao) Peng, A Big Apple for Educators: New York City’s Experiment with Schoolwide Performance Bonuses, RAND Corporation Final Evaluation Report, 2011; http://www.rand.org/content/dam/rand/pubs/monographs/2011/RAND_MG1114.pdf
13. Azam Ahmed, “Judge Sides with Union in Chicago Teacher Layoffs.” Chicago Tribune, October 4, 2010; http://articles.chicagotribune. com/2010-10-04/news/ct-met-cps-teacher-lawsuit-1005-20101004_1_teacher-layoffs-union-and-district-officials-tenured-teachers
14. Lisa Gartner, “Audit: Closing Schools Cost Quadruple the Reported Price Tag,” Washington Examiner, September 9, 2012; http://washingtonexaminer.com/audit-closing-schools-cost-quadruple-the-reported-price-tag/article/2507444
15. Mary Levy, “School ‘Reform’ in DC: Is the Problem Choice or What Compels Families to Choose?” All Things Education (blog), December 5, 2011; http://allthingsedu.blogspot.com/2011/12/school-reform-in-dc-is-problem-choice.html
16. Zakiyah Ansari, “Save Students By Ending Bloomberg’s Destructive School Closings Policy,” Black Star News, May 15, 2012; http://
www.blackstarnews.com/news/135/ARTICLE/8216/2012-05-15.html
17. Urban Youth Collaborative, No Closer to College: NYC High School Students Call for Real School Transformation, Not School Closings, 2011; http://www.urbanyouthcollaborative.org/wp-content/uploads/2011/05/No-Closer-to-College-Report.pdf
18. Clara Hemphill and Kim Nauer, The New Marketplace: How Small-School Reforms and School Choice Have Reshaped New York City’s High Schools, The New School for Management and Urban Policy, 2009; http://www.newschool.edu/milano/nycaffairs/publica- tions_schools_thenewmarketplace.aspx
19. Marisa de la Torre and Julia Gwynne, When Schools Close: Effects on Displaced Students in Chicago Public Schools. Consortium on Chicago School Research at the University of Chicago Urban Education Institute, 2009; http://ccsr.uchicago.edu/publications/ when-schools-close-effects-displaced-students-chicago-public-schools
20. Center for Research on Education Outcomes, Multiple Choice: Charter School Performance in Sixteen States, 2009; http://credo.stan- ford.edu/reports/MULTIPLE_CHOICE_CREDO.pdf
21. Mark Lerner, “Concerns About the Achievement Gap with This Year’s D.C. CAS Results,” Washington Examiner, August 8, 2011;
http://www.examiner.com/article/concerns-about-the-achievement-gap-with-this-year-s-d-c-cas-results
22. Bruce D. Baker and Richard Ferris, Adding Up the Spending: Fiscal Disparities and Philanthropy Among New York City Charter Schools, National Education Policy Center at the University of Colorado, Boulder, 2011; http://nepc.colorado.edu/publication/ NYC-charter-disparities
23. Carol Caref, Sarah Hainds, Kurt Hilgendorf, Pavlyn Jankov, and Kevin Russell, The Black and White of Education in Chicago’s Public Schools: Class, Charters & Chaos: A Hard Look at Privatization Schemes Masquerading as Education Policy. Chicago Teachers Union,
2012; http://www.ctunet.com/blog/the-black-and-white-of-education-in-chicagos-public-schools
24. Dana Goldstein, “Early Thoughts on Joel Klein, Cathie Black and Education Reform in New York,” Washington Pos November 9, 2010, http://voices.washingtonpost.com/ezra-klein/2010/11/early_thoughts_on_joel_klein_c.html; Howard S. Bloom and Rebecca Unterman, Sustained Positive Effects on Graduation Rates Produced by New York City’s Small Public High Schools of Choice, MDRC Policy Brief, 2012; http://www.mdrc.org/sustained-positive-effects-graduation-rates-produced-new-york-city%E2%80%99s-small-public-high-schools
25. Sarah Karp, “Jones and Urban Prep Shine as Citywide College Enrollment Rises,” Catalyst Chicago, August 21, 2012; http://www. catalyst-chicago.org/news/2012/08/21/20362/jones-and-urban-prep-shine-citywide-college-enrollment-rises
26. Hosanna Mahaley, 2012 DC CAS Results, Office of the State Superintendent of Education, 2012; http://osse.dc.gov/sites/default/files/dc/sites/osse/release_content/attachments/DCCAS_2012.pdf
27. New America Foundation, Federal Education Budget Project, “PreK-12” data for CPS, DCPS, and NYCPS 2009–2010; febp.newamer- ica.net/k12
28. Valeria Strauss, “Moco Schools Chief Calls for Three-year Moratorium on Testing,” Washington Post’s The Answer Sheet (blog), December 10, 2012; http://www.washingtonpost.com/blogs/answer-sheet/wp/2012/12/10/moco-schools-chief-calls-for-three-year- moratorium-on-standardized-testing/
29. Heather Schwartz, “Housing Policy is School Policy: Economically Integrated Housing Promotes Academic Success in Montgomery County, Maryland,” in The Future of School Integration: Socioeconomic Diversity as an Education Reform Strategy, Richard D. Kahlen- berg, ed. Century Foundation Press, Washington, D.C., 2012.
30. Joshua P. Starr, testimony before the U.S. House of Representatives Committee on Appropriations Subcommittee on Labor, Health and Human Services, Education, and Related Agencies, March 27, 201

