Spending is an interesting subject. More often than not talk of the topic causes great strife. Marriages end over money. Friendships fracture too. Political parties part ways when the dollars are debated. At the same time, Conservatives, Liberals, and Independents agree; Education is our nation’s priority. We must invest in our children. The young are our future. Every child needs to be afforded an opportunity to succeed. But succeed in what way, how, when, where, and of course, at what cost? These questions or answers cause great consternation
Spend money on my child’s edification? Absolutely, just not mine. Tax the billionaires. Levy my neighbors. ‘I will contribute my fair share, indeed I did, but tax me more…I think not. I might contribute to my child’s classroom. Maybe, but first tell me where will my dollars go and to whom? How will the monies be spent – on what, and when, we ask, but do we stay for the conversation? Rarely.
There are those occasions when we come together to discuss and do or at least we once did. You might recall the bipartisan plan, No Child Left Behind or its forefather, Goals 2000. The two had one thing in common. Each offered simple solutions to a complex problem. Standards and testing. The quantifiable is easy to gather. A look at the charts can be entertaining.
What is fair, equal and equitable funding? What part do our taxes play? Do we furnish enough funds or too few? Are we reassured by reports such as U.S. education spending tops global list, study shows or stumped by what the data reveals?
The United States spends more than other developed nations on its students’ education each year, with parents and private foundations picking up more of the costs…Despite the spending, U.S. students still trail their rivals on international tests.
Tis true. The dollars we devote to support our schools’ teams exemplify the American theme. Education Spending – Made Easy and Entertaining
Yet, with millions coming in, ostensibly to the schools, money can still be tight. So Superintendents squeeze. Administrators axe. If one wants to save money s/he can tailor the reports so that the school appears to be underfunded. If a state Legislator thinks it wise, s/he too can prove the schools are overfunded. Whatever it takes. The objective is do what is easy, and if possible, provide entertainment, a boost. If the two constructs can come together as one, all-the-better. Taxpayers do not wish to feel taxed twice, but to feel tickled, that is a delight.
Diversion, distraction, obfuscation, all are good ways to change the conversation and avoid complaints. Perhaps that is why few offer more than a grumble and fewer bother to cognize…
There are a variety of ways to calculate per-pupil spending. Each has advantages and disadvantages, depending on the intended use of the data. For example, one measure might be useful for comparisons between states, while another measure might be more useful in state budget discussions.
Regardless of the state in which we live, it seems we work together when it is convenient. We come apart expediently. Legislators are as we are and do what we do. Easy and breezy. That’s entertainment, education, and yes, election politics.
Elected officials understand that constituents like a quick fix. The sooner we get it done the sooner the celebration and ceremony. Regalia and rewards are the essence of ease and entertainment. Remember the bipartisan education Bill bliss. No Child Left Behind looked good
Had we done an extensive examination, as difficult as that might have been, we might have concluded that punitive policies are problematic. The popularity of the plans will plunge and the, policymakers associated with these too will fall.
It is the same old story. We spent or spend money on a program that was characterized as the solution! However, in practice it was not a novel approach at all; it was the same. Set standards. Spend money to measure success and then, sit back, relax, and watch the game. After all, it’s exciting, [like watching money.]
Last Saturday, puny Akron almost upset mighty Michigan in Ann Arbor. Late in the game, the Zips allowed the Wolverines to grab the lead and then almost, but not quite, took it back with seconds left—failing to score from the Michigan 4-yard line as the clock ran out. More than 107,000 fans were on hand to cheer the Wolverines on, which may sound like a lot, but only a week before more than 115,000 had watched Michigan beat Notre Dame (a lot more easily). That attendance number was a record for the stadium and for an NCAA football game.
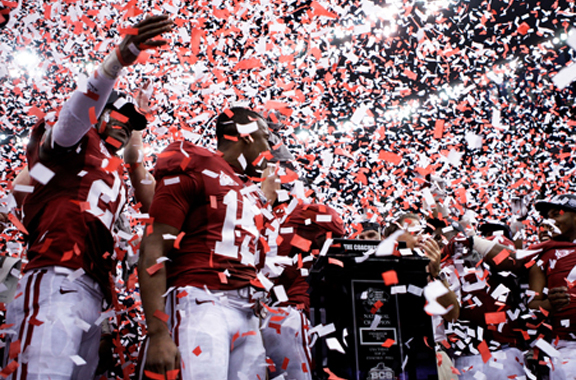
Fans file into packed stadiums. The cost for seats may be high but so too is the feeling. Forget your sorrows. Ignore the veracity that only 22 of these colleges have self-sufficient athletic departments. In most of the 227 public institutions playing Division 1 sports, taxpayers and students subsidize the athletic divisions. But don’t worry. Be happy. Your ticket and concession fees are appreciated. While we cannot calculate what per-pupil-spending means, we can be certain that The University of Cincinnati and Miami University in Oxford, Ohio, are glad that you are there. The two added $6 million and $1.2 million, respectively, this year to prop up their already heavily subsidized sports programs. And without you and your belief in education, where would the teams be? Strapped!
Without money from those who find an easy and entertaining way to spend on education, subsidized sports departments would be out of business. Athletics in education would be looking for a scintillating slant, and perchance a slogan. “Join us. Education Spending; it is easy and entertaining”
References and Resources…
- U.S. education spending tops global list, study shows CBS News. June 25, 2013
- Hard Knocks for America’s Game—Mark Yost on football’s image problem, By Mark Yost. The Wall Street Journal. September 20, 2013
- College Sports Spending: The Real March Madness? By Sean Gregory. Time. March 21, 2013
- USA Today. September 2013
- Athletics spending outpaces academics in NCAA schools, including UNC, NC State, By Jane Stancill. News Observer. December 4, 2013
- We Must Fight Poverty As We Fix Our Schools. By Dan Montgomery. The Huffington
post. December 4, 2013 - The PISA 2012 scores show the failure of ‘market based’ education reform, By Pasi Sahlberg. The Guardian. December 8, 2013
- Numbers Can Lie: What TIMSS and PISA Truly Tell Us, if Anything? By Yong Zhao. December 11, 2012
- Tom Loveless: Shanghai PISA Test Scores Almost Meaningless; Hukou a Factor, By Fred Dews. EmpathyEducates. December 3, 2013
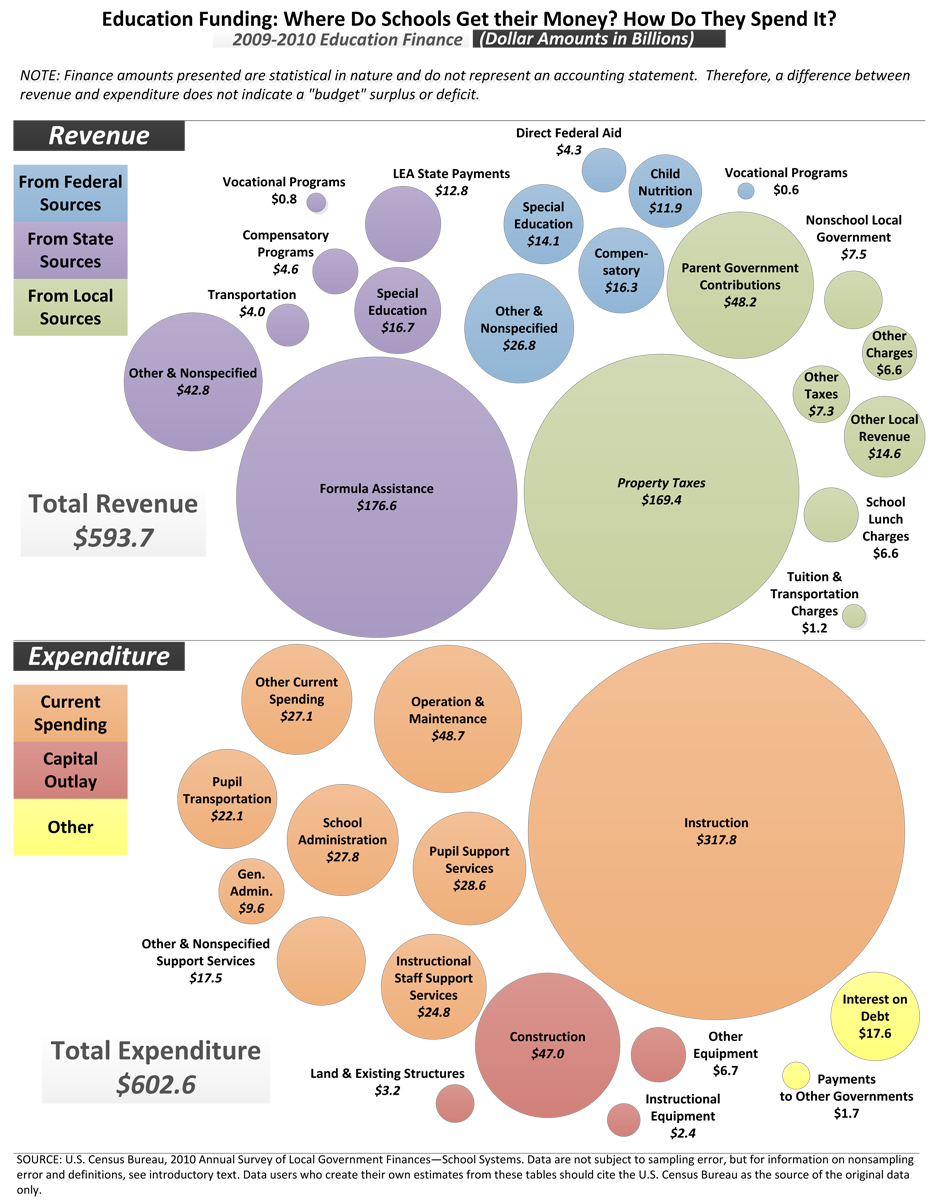
The Census Bureau compiles data on education spending per pupil and elementary/secondary education revenues for each state.
Spending amounts shown reflects current spending, which does not include capital outlays, interest on debts and payments to other governments. Data was last updated in May 2013 for fiscal year 2011.
Please note that the reported totals cannot be reliably compared among states. Figures reported do not account for discrepancies in cost of living, which are typically calculated for specific metropolitan areas. In addition, accounting methods vary among state agencies. (State-by-state differences are listed in Appendix B of the Census Bureau’s report on education finances).
Select a state in the menu below to view historical education revenues and expenditures by state, or refer to the table below to compare state totals for the most recently released 2011 data.



Leave A Comment