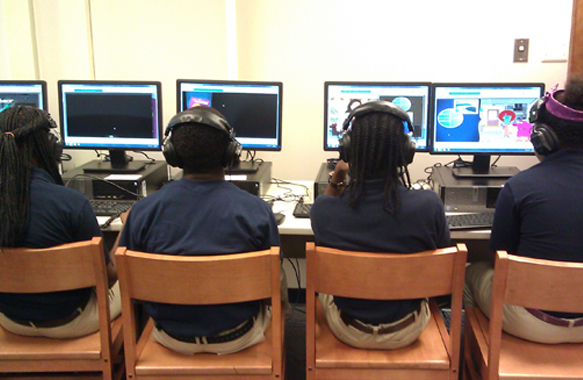
Photograph; as a designated “welcoming school,” Johnson School of Excellence on the West Side got upgrades to technology. But only 34 students out of 145 from shuttered Pope Elementary are enrolled at the school, according to CPS figures | WBEZ/Linda Lutton
By Linda Lutton | Originally Published at WBEZ Radio. October 14, 2013
Far fewer students from Chicago’s closed elementary schools are enrolled where the district thought they would be this fall.
Just 60 percent of 10,542 students* from Chicago’s shuttered elementary schools ended up at so-called “welcoming schools,” despite efforts by the district to woo them with promises of improved education, safe passage to school, and sweeteners like iPads, air conditioning and new science labs.
The districtinsisted throughout the summer that 80 percent of students from closing schools were enrolled at their designated welcoming schools. Even the first day of school, CPS said 78 percent of impacted students were attending their welcoming schools. The district made $155.7 million in capital and technology investments at the schools, which it will pay off for the next 30 years.
But enrollment figures obtained by WBEZ through an open records request show CPS overstated enrollment at the receiving schools by more than 2,000 students. The enrollment snapshot, taken on the 20th day of school, also shows:
- 496 grammar-school children from shuttered schools do not seem to be enrolled anywhere at all, inside CPS or in other districts. They are listed on district spreadsheets as “To be determined” and are from nearly every closed school.
- Students from closed schools have scattered throughout the system, attending 410 different schools—even more than initial counts indicated.
At Johnson School of Excellence, a designated welcoming school for shuttered Pope Elementary, just 34 kids enrolled from Pope—77 percent of Pope students went elsewhere.
Diaspora: Students from closed schools have scattered throughout the system
“De facto” welcoming schools, with the total number of students they have enrolled from closed schools
| Closed School | Number of different CPS schools where students are now enrolled |
|---|---|
| ROSS | 57 |
| ALTGELD | 47 |
| WOODS | 47 |
| LAFAYETTE | 44: |
| PARKMAN | 44 |
| TRUMBULL | 44 |
| KOHN | 43 |
| BONTEMPS | 42 |
| EMMET | 42 |
| OVERTON | 41 |
| MAY | 40 |
| LAWRENCE | 39 |
| BETHUNE | 38 |
| GOLDBLATT | 38 |
| MAYO | 38: |
| CALHOUN | 37 |
| POPE | 38 |
| HENSON | 35 |
| SEXTON | 35 |
| SONGHAI | 35 |
| STOCKTON | 35 |
| KEY | 34 |
| MARCONI | 34 |
| OWENS | 34 |
| DUMAS TECH ACAD | 33 |
“You know, during the hearings and during that entire process, it’s a pretty tumultuous, ugly process,” said Henry. “And feelings are developed, some problems kind of develop. It may take a year.”
School board member Andrea Zopp is also taking a longer view, and says the capital and technology investments the district made will attract students eventually.
“Over time, I think that will shake out. These schools are going to be community hubs. And I think they’re going to draw—like good schools do—they’re going to draw kids and families back into the neighborhood schools, and that’s the goal.”
Some schools not designated as welcoming schools took in more students from closed schools than designated welcoming schools. But the “de facto” welcoming schools didn’t get technology or capital upgrades, and are not part of the district’s $12 million Safe Passage program. And a number of them struggle academically, meaning children from closed schools are attending schools that may be performing worse than the closed schools they left.
“De facto” welcoming schools, with the total number of students they have enrolled from closed schools
| School | Designated welcoming School? | Number of students from closed schools | |
|---|---|---|---|
| KELLMAN | No | 159 | |
| LANGFORD | No | 86 | |
| METCALFE | No | 76: | |
| CHALMERS | No | 64: | |
| MOOS | No | 53 | |
| CATALYST CHTR – HOWLAND | No | 52 | |
| CROWN | no | 49 | |
| CARTER | No | 46 | |
| PENN | No | 46 | |
| LOWELL | No | 45 | |
| PARKER | No | 44 | |
| IRVING | No | 43 |
Receiving schools that did best at enrolling students from closed schools were those where the building didn’t close. For instance, Pershing Middle School closed, but the building itself remained open, and staff from Pershing Elementary moved in and took over, making it a K-8 school. Ninety percent of students from Pershing Middle stayed for the transition.
Asked about the fact that just 60 percent of students from closed schools enrolled in their designated welcoming school, spokeswoman Becky Carroll said CPS supports parents’ right to choose where to enroll their children.
“Thousands of parents every year choose to enroll their child at a different school in our district –or even outside the district—and we support them in those choices,” Carroll wrote in an email. She wrote that the “far majority” of parents from closed schools chose to send their children to their designated welcoming school, and those children “are now receiving a higher-quality education with the resources they need to succeed and thrive in the classroom.”
Regarding the nearly 500 students the district cannot account for, officials have said district employees have called, written and gone door to door looking for them.
Percent of students from CPS closed schools attending their designated welcoming school
| Closed school | Total number of impacted students | Designated welcoming school | Number of students attending designated welcoming school | % attending designated welcoming school(s) | Did CPS name more than one receiving school? |
|---|---|---|---|---|---|
| ALTGELD | 335 | WENTWORTH | 235 | 70.1% | |
| ARMSTRONG, L | 92 | LELAND | 48 | 52.2% | |
| BANNEKER | 261 | MAYS: | 214 | 82% | |
| BETHUNE | 315 | GREGORY: | 23 | ||
| BONTEMPS | 239 | NICHOLSON TECH ACAD | 71 | 29.7% | |
| CALHOUN | 234 | CATHER | 115 | 49.1% | |
| DELANO | 259 | MELODY | 217 | ||
| DUMAS TECH ACAD | 241 | WADSWORTH | 183 | 75.9% | |
| DUPREY | 92 | DIEGO | 46 | 50% | |
| EMMET | 316 | DE PRIEST | 95 | 30.1% | yes |
| EMMET | 316 | ELLINGTON | 111 | 35.1% | yes |
| FERMI | 191 | SOUTHSHORE | 154 | 80.6% | |
| GARFIELD PARK | 132 | FARADAY | 49 | 37.1% | |
| GOLDBLATT | 213 | HEFFERAN | 100 | 46.9% | |
| GOODLOW | 285 | EARLE | 198 | 69.5% | |
| HENSON | 196 | HUGHES, C | 12 | 6.1% | |
| HERBERT | 205 | DETT | 162 | 79% | |
| KEY | 283 | ELLINGTON | 170 | 60.1% | |
| KING | 204 | JENSEN | 84 | 41.2% | |
| KOHN | 323 | CULLEN | 14 | 4.3% | yes |
| KOHN | 323 | LAVIZZO | 47 | 14.6% | yes |
| KOHN | 323 | HUGHES, L | 167 | 51.7% | yes |
| LAFAYETTE | 306 | CHOPIN | 209 | 68.3% | |
| LAWRENCE | 318 | BURNHAM | 240 | 75.5% | |
| MARCONI | 177 | TILTON | 65 | 36.7% | |
| MAY | 386 | LELAND | 285 | 73.8% | |
| MAYO | 326 | WELLS, I | 242 | 74.2% | |
| MORGAN | 157 | RYDER | 101 | 64.3% | |
| OVERTON | 284 | MOLLISON | 146 | 51.4% | |
| OWENS | 250 | GOMPERS | 175 | 70% | |
| PADEREWSKI | 150 | CARDENAS | 24 | 16% | yes |
| PADEREWSKI | 150 | CASTELLANOS | 38 | 25.3% | yes |
| PARKMAN | 156 | SHERWOOD | 52 | 33.3% | |
| PEABODY | 211 | OTIS | 162 | 76.8% | |
| PERSHING MIDDLE | 175 | PERSHING | 158 | 90.3% | |
| POPE | 145 | JOHNSON | 34 | 23.4% | |
| ROSS | 272 | DULLES | 117 | 43% | |
| RYERSON | 326 | WARD, L | 261 | 80.1% | |
| SEXTON | 309 | FISKE | 218 | 70.6% | |
| SONGHAI | 258 | CURTIS | 104 | 40.3% | |
| STEWART | 196 | BRENNEMANN | 117 | 59.7% | |
| STOCKTON | 299 | COURTENAY | 247 | 82.6% | |
| TRUMBULL | 206 | MCCUTCHEON | 11 | 5.3% | yes | TRUMBULL | 206 | MCPHERSON | 50 | 24.3% | yes | TRUMBULL | 206 | CHAPPELL | 98 | 47.6% | yes |
| VON HUMBOLDT | 264 | DIEGO | 169 | 64% | |
| WEST PULLMAN | 233 | HALEY | 76 | 32.6% | |
| WILIAMS MIDDLE | 80 | DRAKE | 58 | 72.5% | |
| WILLIAMS ES | 211 | DRAKE | 169 | 80.1% | |
| WOODS | 274 | BASS | 127 | 46.4% | |
| YALE | 157 | HARVARD | 67 | 42.7% | GRAND TOTAL | 10,542 | HARVARD | 6,335 | 60.1% |
*The district’s 20th Day figures show a total of 11,126 students attended kindergarten through 7th grade last year at 47 schools that closed for good in June. Of those, 584 were enrolled in two special education schools or in special education “cluster programs”; 10,542 were in general education programs.
Original data from Chicago Public Schools is attached below.







Leave A Comment