Project Description
Comparison of 2014 The Louisiana Educational Assessment Program (LEAP) Results
Recovery School District-New Orleans to All Louisiana Public School Districts
Research on Reforms Reports | August 5, 2014
Charles J. Hatfield, Co-Founder of Research on Reforms | Email: cjhatfield@researchonreforms.org
It is generally accepted that the Orleans Parish Schools taken over by the Recovery District in New Orleans (RSD-NO), as a group, performed at or near the bottom for achievement levels on The Louisiana Educational Assessment Program (LEAP). Nevertheless, ardent supporters of this “reform” movement reported “achievement gains” during the past nine years. Currently, as before, based on the latest LEAP results, the RSD-NO performs below the vast majority of the other Louisiana school districts at the 4th and 8th grade levels.
Comparison of 2014 LEAP Results for RSD-NO to All Louisiana Public School Districts
This report analyzes the 2014 4th and 2014 8th LEAP summary test results for the Recovery District in New Orleans (RSD-NO). These 4th and 8th grade students have probably attended RSD-NO schools since the first grade.1 Therefore, one would expect that they benefited considerably more from their instructional experiences in RSD-NO than their pre-Katrina counterparts. Research on Reforms (ROR) expected that, as a group, these students would not score at or near the bottom of the 2014 LEAP tests, but that did not happen.
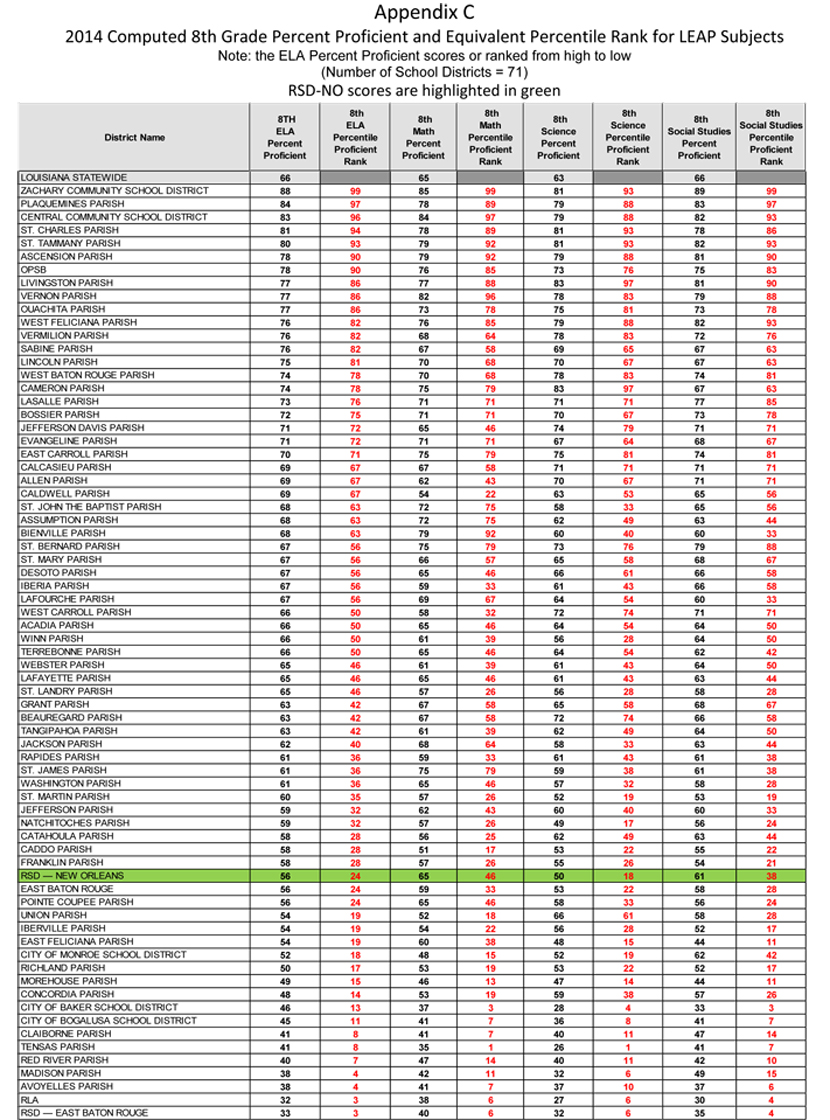
This report presents the 2014 percent proficient scores and their equivalent percentile ranks for these grade levels in English Language Arts (ELA), mathematics, science and social studies.2 Percent proficient, as used in this report, represents the percent of students scoring at or above Basic on the LEAP tests. The percentile rank refers to the percent of school districts whose percent proficient score is less than that for a given district’s score. Percentile ranks range from 1 to 99. See Appendix A for descriptions the various statistical terms used in this report.

It can also be observed that the performance of the RSD-NO, in all of the subjects at the 4th grade level, is not only below the 50th percentile, i.e. median, but also below the 25thpercentile, 1st quartile, which represents the bottom part of the distribution of percent proficient scores. Performance in science is the lowest of the core subjects tested.
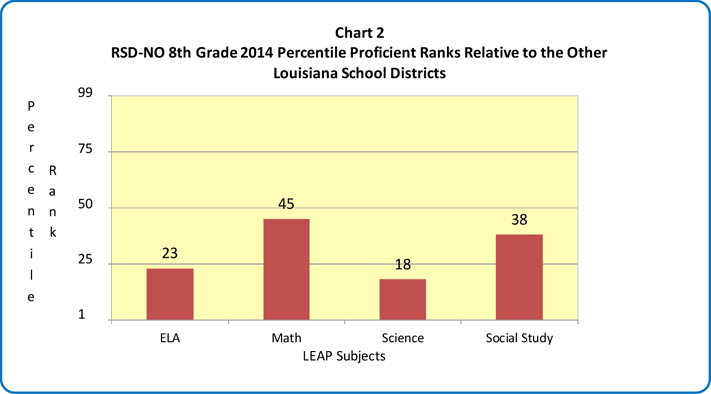
Chart 2 presents the results for 8th grade. It shows that compared to the other school districts in the state, the RSD-NO’s 8th graders have a percentile rank of only 23 in ELA. Its percent proficiency score is 56 (See Appendix C). This means that only 23% of the other school districts in Louisiana have a percent proficient score less than 56.
In mathematics, the RSD-NO 8thgraders have a percentile rank of 45 (See Appendix Chart 2
RSD-NO 8th Grade 2014 Percentile Proficient Ranks Relative to the Other Louisiana School Districts
45 is equivalent to a percent proficient score of 65. This means that 45% of the other school districts have percent proficient scores less than 65. It can also be observed that the performance of the RSD-NO is below the 25th percentile in each subject except for mathematics and social studies. Similar to 4th grade results, 8th grade performance in science is the lowest of the core subjects tested. Unpublished, preliminary analysis by ROR of RSD-NO’s 2014 iLEAP results for the 3rd, 5th 6th , and 7th graders show that their performance in science is also relatively worse than in the other iLEAP subjects.
The 8th grade performance in mathematics is particularly noteworthy since its percentile rank of 45 is approaching the 50th percentile which is the median percentile proficiency rank. What makes this performance interesting is that the 2014 transitional LEAP tests incorporated the Common Core State Standards (CCSS).These standards are designed to be more rigorous than the old accountability standards. Therefore, one would have expected the performance in mathematics to be much worse than that reported. Whether these mathematics results are valid or questionable is beyond the scope of this report at this time. One has to trust the validity of the LDOE’s data until proven otherwise and give kudos to 8th grade teachers of mathematics.

John McCusker, The Times-Picayune
In 2002, the Louisiana State Department of Education (LDOE) set a new student achievement goal of 100% percent proficient in ELA and mathematics by the spring of 2014. Yet, none of Louisiana school districts achieved this unreasonable goal at the 4th and 8th grade levels.4
Now, the pendulum has swung back and the LDOE is starting all over again by raising the achievement bar and pursuing an even more unreasonable goal for 2025, i.e., 100% achievement at the mastery level in ELA and mathematics by 2025. This new goal is predicated on the successful implementation of the Common Core State Standards (CCSS) and their associated new assessments, i.e., Partnership for Assessment of Readiness for College and Careers (PARCC). According to a news release by the LDOE’s superintendent, John White, the new mastery goal and higher expectations are necessary since achievement at the basic level, “… does not correspond with community college or university success. While 69 percent of students hit this mark, for example, only 28 percent complete a university or community college degree…” This is an extremely important point. However, whether this is true or not is debatable since the LDOE did not present any empirical data or other references to the public to support this assertion.
As of this writing, the implementation of these new standards and assessments are stalled in an educational/political/economic/power quagmire among the governor, BESE, and LDOE. BESE and the governor are suing each other over the implementation of CCSS and PARCC. What an imbroglio this is for the parents, students, educators and the general public of Louisiana. It is too early to determine the far reaching consequences of this controversy, except to state that ROR believes it will wreak havoc on the Louisiana public educational system unless settled quickly. This reform movement has degenerated into a “Louisiana Circus,” as acclaimed critic, Dianne Ravitch, has so aptly exclaimed.
Endnotes
2 ROR computed percent proficient scores for each school district by adding the percent of students that scored at or above basic in each district. When the data were suppressed by the LDOE in any of those achievement categories, the percent proficient was computed by adding the percent of students scoring in Approaching Basic and Unsatisfactory and then subtracting that sum from 100. Using these two scenarios, ROR was able to generate percent proficient scores for all of the districts reported. The percentile rank associated with each proficient score was then generated using 2010 Microsoft Excel’s Percentrank.exc function. Percent proficient and percentile ranks were not computed for the combined results of the RSD-NO and RSD-EBR.
It should be emphasized that after the 2010 spring testing, the LDOE revised its reporting methods for reporting students scoring in each of the five LEAP achievement levels, i.e., Advanced, Mastery, Basic, Approaching Basic and Unsatisfactory. It now reports only percent of students scoring in each of the achievement category along with suppressed percentages and enrollment numbers. The LDOE suppresses percent and numbers by adding “≥” or “≤” in from of them. This tactic severely limits the scope of researchers or general public from re-configuring or analyzing the LDOE’s data to answer their own specific questions. The reader is again referred to the LEAP reports for 4th and 8th referenced earlier for examples of this.
3 The LDOE reports whole rounded numbers for percent proficient. This may result in rounding errors when computing percentile ranks. These rounded percent proficient scores are the best available data from the LDOE at this time.
4 No Child Left Behind Act of 2001, Public Law 107‐110, and Section 101
Appendix A | Definitions of Major Statistical Terms Used in Report
Number Proficient/Mastery: In LEAP and iLEAP, the proficient score represents the number of students scoring at Basic or above, i.e., Basic, Mastery or Advanced. Number Mastery is the number of students scoring at Mastery or above, i.e., Mastery or Advanced.
Percent Proficient/Mastery: In LEAP and iLEAP, the proficient score represents the number of students scoring Basic or above, i.e., Basic, Mastery or Advanced, divided by the total number of students tested. Percent Mastery is the number of students scoring at Mastery or above, i.e., Mastery or Advanced, divided by the number of students tested.
Percentile/Percentile Rank: A percentile rank indicates what percent of scores are lower than a given score in a distribution of scores. Percentile ranks and associated quartiles generally provide more information about district test scores in terms of how they compare to each other, than raw scores such as scaled scores, percent correct or percentages. It is important to emphasize that a percentile rank represents a type of measurement that should not be added or subtracted from one another. One can only assess whether a rank is higher or lower than another. Percentile rank definitions can vary. The definition of percentile rank used in this paper is that it represents the percentage of district proficient scores that fall below a given score.
Quartile: Percentile distributions range from 1 to 99. A quartile is “…One of the three points that divide a range of data or population into four equal parts. The first quartile (also called the lower quartile) is the number below which 25 percent of the bottom data falls. The second quartile (the median) divides the range in the middle and has 50 percent of the data are below it and 50% are above. The third quartile (also called the upper quartile) has 75 percent of the data below it and the top 25 percent of the data above it… ”
Mean/Median/Mode: “…Mean, median, and mode are three kinds of averages. There are many “averages” in statistics, but these are … the three most common… The mean is the average … where you add up all the numbers and then divide by the number of numbers. The median is the middle value in the list of numbers… The ‘mode’ is the value that occurs most often…”
Appendix B | 2014 Computed 4th Grade Percent Proficient and Equivalent Percentile Rank for LEAP Subjects

Appendix C | 2014 Computed 8th Grade Percent Proficient and Equivalent Percentile Rank for LEAP Subjects