It begins at birth, or perhaps at conception. Some babies are conceived to parents of means. Their Moms have access to adequate health care. Prenatal preventative measures to ward off ill-health are provided. During delivery, the parents receive attention, as does the child receives. Day-care, kindergarten, and schooling too are afforded to individuals who earn an income that is abundantly adequate, stable, or substantial. Those professionals in the “middle” may struggle, more so in recent years, but less so than the burgeoning class of service workers. You may think that portion of the population is small, made-up mostly of teens, and the un or undereducated. And you would be wrong. The Characteristics of the Minimum Wage Worker are vast and often not as expected.
In 2011, 73.9 million American workers age 16 and over were paid at hourly rates, representing 59.1 percent of all wage and salary workers.1 Among those paid by the hour, 1.7 million earned exactly the prevailing Federal minimum wage of $7.25 per hour. About 2.2 million had wages below the minimum.2 Together, these 3.8 million workers with wages at or below the Federal minimum made up 5.2 percent of all hourly-paid workers. Tables 1 through 10 present data on a wide array of demographic and socioeconomic characteristics for hourly-paid workers earning at or below the Federal minimum wage. The following are some highlights from the 2011 data.
- Minimum wage workers tend to be young. Although workers under age 25 represented only about one-fifth of hourly-paid workers, they made up about half of those paid the Federal minimum wage or less. Among employed teenagers paid by the hour, about 23 percent earned the minimum wage or less, compared with about 3 percent of workers age 25 and over. (See table 1 and table 7.)
- About 6 percent of women paid hourly rates had wages at or below the prevailing Federal minimum, compared with about 4 percent of men. (See table 1.)
- About 5 percent of White hourly-paid workers earned the Federal minimum wage or less, compared with about 6 percent of Blacks and about 3 percent of Asians. Among hourly-paid workers of Hispanic ethnicity, about 5 percent earned the minimum wage or less. (See table 1.)
- Among hourly-paid workers age 16 and over, about 11 percent of those who had less than a high school diploma earned the Federal minimum wage or less, compared with about 5 percent of those who had a high school diploma (with no college) and about 2 percent of college graduates. (See table 6.)
And thus the question is again, is education enough to ensure sufficient earnings? Perhaps not. Late in June 2013, the Federal Reserve Bank of New York reported that a full 44 percent of recent college graduates were underemployed as of 2012, Underemployment is defined as working in jobs that did not require their degrees. Half Of Recent College Grads Work Jobs That Don’t Require A Degree. Why might this be. Let us look at the most recent report. Ultimately, the estimation and consensus is separate is unequal! Not all college attendees, graduates, and colleges are equal: Typical alumnae of elite private schools make more money than graduates of flagship state universities, but those more “lowly” alumni do much better than those attending relatively non-selective institutions.
In short, not all majors are equal; nor are costs, and indebtedness dependent on student loans. Thus, argue as we might whether one minimum wage is reasonable, and at what rate, to do nothing is surely objectionable. Please consider the numbers, our history, and the possibilities.
For information about where your State minimum wage-workers stand, please refer to The Demographics of Workers, State-By-State
Easily Sharable Minimum Wage Graphics
By Dan Essrow and Dan Crawford Economic Policy Institute July 24, 2013
In a speech today outlining his economic agenda for the next two-and-a-half years, President Obama repeated his call for raising the minimum wage.
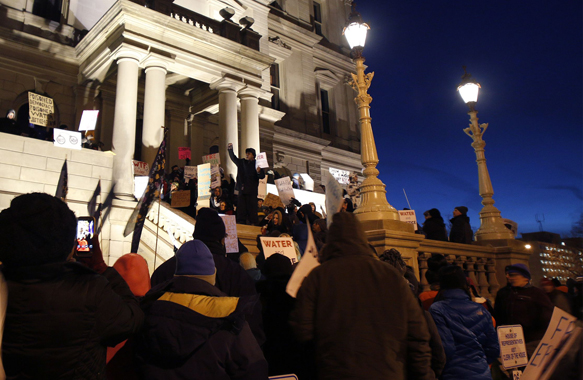
At the same time, today was a national day of action in support of a higher minimum wage. Americans throughout the country rallied to support legislation that would raise the minimum wage to $10.10 per hour and index it to inflation.
EPI has long supported raising the minimum wage, and it’s great to see the president, lawmakers and activists making the case for a minimum wage increase. Raising the minimum wage would boost the incomes of millions of Americans, provide a modest economic stimulus, and slow the growth of income inequality.
The inflation-adjusted value of the minimum wage is lower today than it was in 1968. If the value of the minimum wage had kept pace with average wages since then, it would be $10.50 today. If it had increased alongside productivity, it would be $18.75 today. And if it had increased at the same rate as the wages of the top 1.0 percent, it would be over $28 per hour.
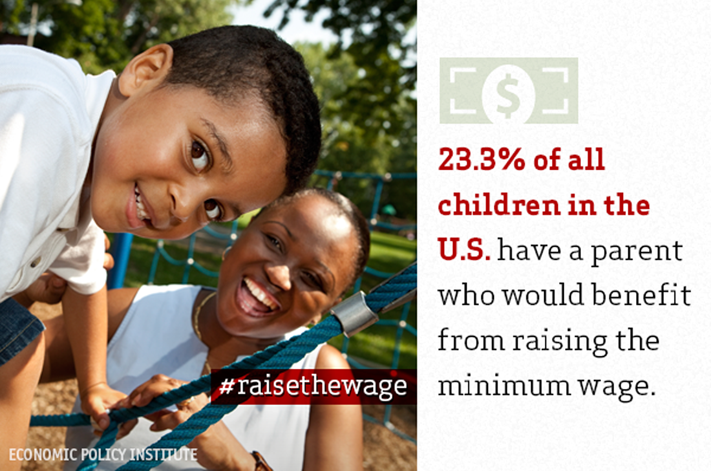
In support of the national day of action, we made a series of graphics with facts about who would be affected by a minimum wage increase, and why it’s a good idea. They’re quick, to the point and easily shareable. The data points come from this paper. Check them out:
See more at: http://www.epi.org/blog/minimum-wage-graphics/#sthash.bGzAo3Jh.dpuf


Leave A Comment