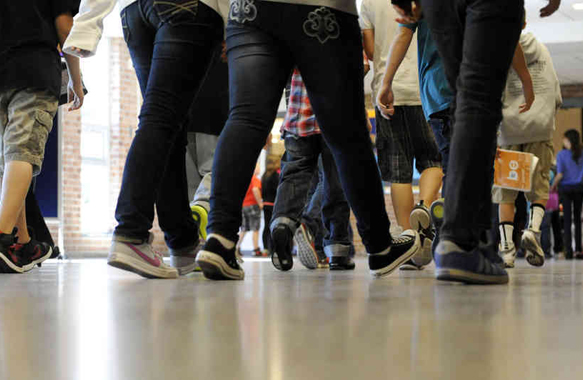
Photograph; Students walk in the hallway as they enter the lunch line of the cafeteria at Draper Middle School in Rotterdam, N.Y. | Hans Pennink/AP
By Ben Casselman | Originally Published at FiveThirtyEight. June 10, 2014 6:52 AM
The slow economic recovery is taking a toll on the nation’s public schools, reversing a multi-decade trend of increased funding and pushing student-teacher ratios to their highest levels since 2000.
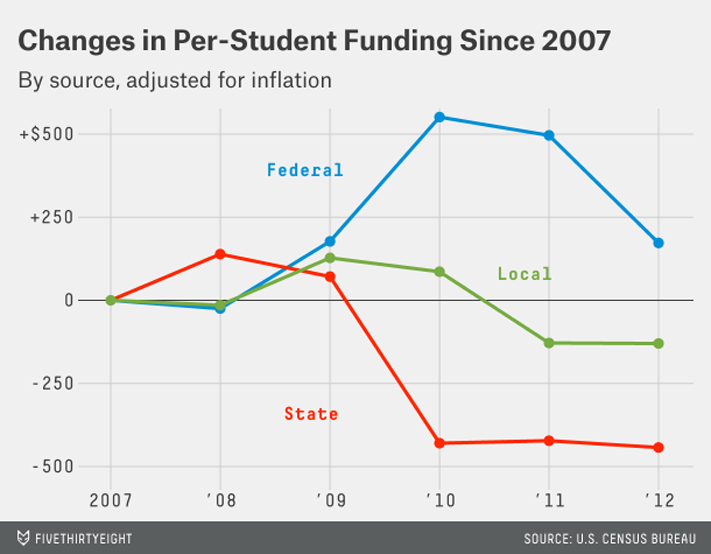
U.S. schools actually weathered the recession itself relatively well. State funding, which accounts for about 45 percent of school revenues on average, fell sharply during the downturn, while local spending, which accounts for roughly another 45 percent, mostly from property taxes, was essentially flat. But federal stimulus dollars helped plug the gap, offsetting the worst of the state-level cuts. Both per-student spending and student-teacher ratios improved modestly during the recession.
Once the recession ended, however, so did the stimulus — long before state and local governments were ready to pick up the slack. Federal per-student spending fell more than 20 percent from 2010 to 2012, and it has continued to fall. State and local funding per student were essentially flat in 2012, the most recent year for which data is available.
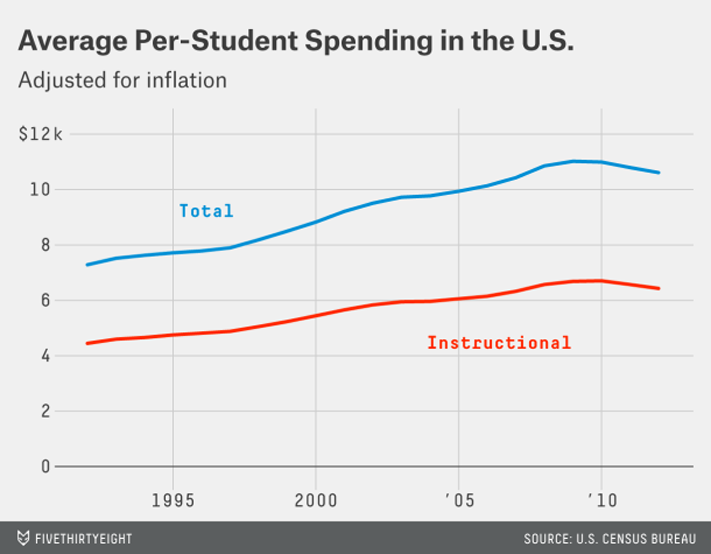
The result: Total school funding fell in 2012 for the first time since 1977, the Census Bureau reported last month. Adjusting for inflation and growth in student enrollment, spending fell every year from 2010 to 2012, even as costs for health care, pension plans and special education programs continued to rise faster than inflation.1 Urban districts have been particularly hard-hit by the cuts in federal education spending: Nearly 90 percent of big-city school districts spent less per student in 2012 than when the recession ended in 2009.2
The cuts are increasingly hitting classrooms directly. In the recession and the early stages of the recovery, superintendents were largely able to protect instructional expenses such as teacher salaries by cutting from other areas, such as administration and maintenance. But that has become more difficult over time. In the 2011-12 school year, classroom spending fell faster than overall spending.
“You end up with few alternatives but to have it hit the classroom in one way or another,” said McKell Withers, superintendent of schools in Salt Lake City, where inflation-adjusted per-student spending fell 10 percent between 2009 and 2012. “Everything that we could do to try to buffer the impact is now dried up and gone.”
The recent cuts represent a sharp reversal after decades of rising U.S. education spending. In 1950, American school districts spent, on average, roughly $1,800 per student. Spending has risen nearly every year since then; by 2006-07, the last full school year before the recession, per-student spending was nearly $11,000. (Both figures have been adjusted for inflation.) The long increase reflected a range of factors, among them higher teacher salaries, broader curricular and extracurricular offerings, and, especially in recent years, increased spending on students with disabilities. Another major factor: smaller class sizes. In the 1950s, there were roughly 25 students for every teacher; by 2007, the ratio had fallen to 15.5-to-one.
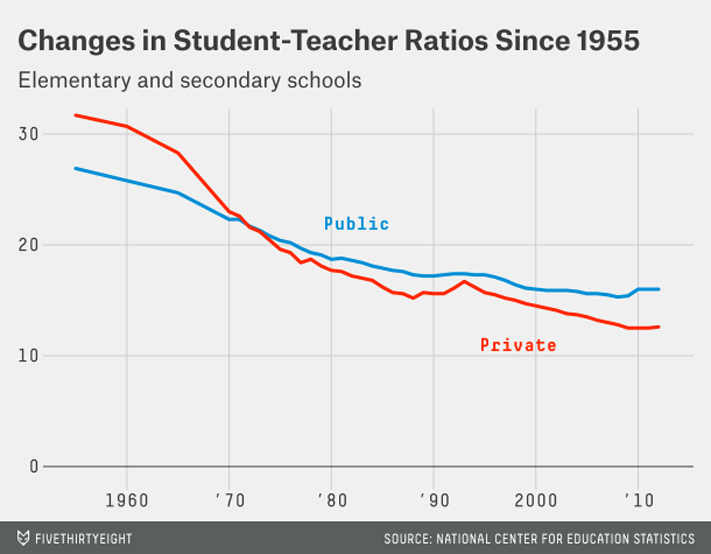
The recent reversal has been modest by historical standards. Nationally, the student-teacher ratio is now 16-to-one, the same level as in 2000, and per-student spending is at about $10,600, roughly the 2006 level after adjusting for inflation. Primary and secondary schools were far from the only government program to face the budget axe in recent years; state funding for higher education, in particular, has suffered even bigger cuts.
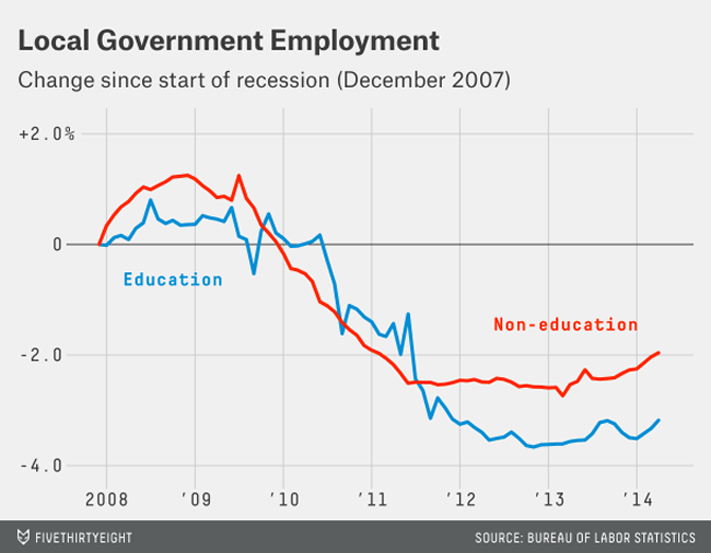
But school financing has been slow to rebound even as the economy improves. Detailed funding data for more recent years isn’t yet available, but a recent analysis of state budgets from the Center on Budget Policy and Priorities, a left-leaning think tank, found that at least 35 states spent less per student in the 2013-14 school year than they did before the recession. Between June 2009, when the recession ended, and November 2012, the lowest point for local education employment, districts cut nearly 350,000 workers. They’ve hired fewer than 40,000 of them back since then — a slower rebound than other local government employees, such as firefighters and police officers.
“The kids who started kindergarten in fall of 2007, these kids are in sixth grade now,” said Noelle Ellerson, associate executive director of the American Association of School Administrators. “Half of their educational experience in the K-12 system has not been in prerecession funding levels.”
The cuts haven’t been evenly distributed. Most federal education aid targets two groups, low-income and special education students, who are overrepresented in urban school districts. As a result, urban districts have been hit harder by the recent cuts. (For the same reason, urban districts also disproportionately benefited from the stimulus.) Overall, 64 percent of the nation’s more than 14,000 school districts spent less per student in 2012 than in 2009, after adjusting for inflation. But 82 percent of urban districts cut funding; in cities with populations of 250,000 or more, 89 percent of districts cut funding.3
In many cities, budget cuts have been compounded by a separate, long-standing problem: falling student enrollments. Many U.S. cities, particularly in the East and Midwest, have seen their populations decline in recent decades, particularly among residents with school-age children. More recently, many urban school districts have faced increased competition from charter schools, which are publicly funded but operate independently of cities’ main school systems.
Kansas City, Missouri, for example, has seen enrollment in its public schools cut in half over the past decade, from nearly 39,000 in 2002 to less than 17,000 in 2012. The steep decline in enrollment left the city with cavernous, costly buildings capable of holdings tens of thousands more students than it actually had. But like many districts, Kansas City was slow to adjust, continuing to operate half-empty buildings rather than grapple with the painful and controversial process of school closures.
When the post-recession budget cuts hit, the reckoning finally came: Kansas City was forced to slash spending across the board, closing dozens of schools, laying off hundreds of employees and paring back or eliminating arts, athletics and other programs. Per-student spending fell by a third between 2009 and 2012 because of budget cuts at the local, state and federal levels. Closing schools and cutting expenses helped the district address its budget challenges, but not without cost. In 2012, the district lost its accreditation and faced a possible state takeover.
Superintendent R. Stephen Green, who took over in 2011, said that the worst of the cuts are over and that he is working to restore some of the classes and programs that were eliminated. The state has backed off plans to take control of the district, and Green said he expects to regain at least provisional accreditation this year. But he said the slow economic rebound means that even as he is restoring some programs, he is cutting others.
“I think we see some light at the end of the tunnel,” Green said. But, he added, “as goes the economy, so goes that possibility.”
FOOTNOTES
1] Per-pupil spending figures are so-called current expenditures (excluding capital spending) for students in pre-kindergarten through 12th grade. I adjust for inflation using the Consumer Price Index, which is the standard inflation measure used by the Department of Education. There’s an argument for using a different inflation measure, the Bureau of Economic Analysis’s implicit price deflator, instead of CPI. Education spending includes items such as building maintenance, employee benefits and other items that aren’t fully reflected in consumer-price measures. The deflator, which does cover such items, typically shows a lower rate of inflation than CPI but is almost identical to the Federal Reserve’s preferred measure of consumer prices, the Personal Consumption Expenditure price index. For the sake of robustness, I ran this analysis using the deflator as well as CPI; the postrecession decline in inflation-adjusted spending was modestly smaller using the deflator, but the main trends were unchanged. ^
2] When referring to budgets, years in this article refer to fiscal years, which in most cases roughly correspond with school years. The 2009 fiscal year is the 2008-09 school year. ^
3] These calculations are based on the National Center for Education Statistics’ local designations, which identify districts as being urban, suburban, town or rural. The NCES further breaks down those categories into large, medium and small cities (and has similar subcategories for other designations). ^
Ben Casselman is FiveThirtyEight’s chief economics writer.








This is because too much money is going toward standardized testing instead of actually serving the students.
Dear Michelle…
Perhaps, there is far more to consider. I think of the “No New Taxes” agenda that has captured the nation since the 1970s. Then there is what has existed since before we became a nation…Throughout our history there has been a desire to privatize and to preserve religion. We call this freedom and choice. It often expresses itself in an ever-present suspicion. I trust you have heard and seen it. Government is too frequently seen as the enemy. How often it is ignored that government is we; it is of, by, and the people!
Testing, I believe is but another tool in the box we have proliferated. The Education-Industrial Complex! Investments are for profit. There is nothing left for the children, for the citzenry.. what becomes of you and me? And what of our communities..our neighborhood schools…and the country?