Project Description
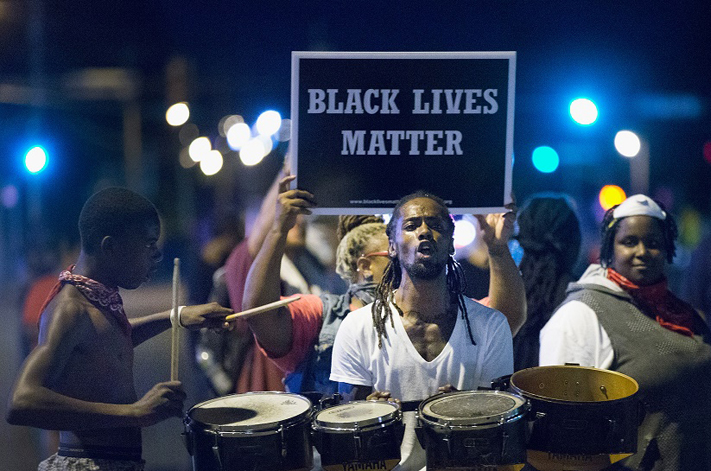
This Is The Movement launched Mapping Police Violence, a set of comprehensive maps of at least 302 Black people killed by police in the United States in 2014.
Get the facts about police violence in your community to make the case for change.
© OpenStreetMap contributors © CartoDB, CartoDB attribution pause 11/29/2014
302 Black Lives Lost to Police Violence in 2014
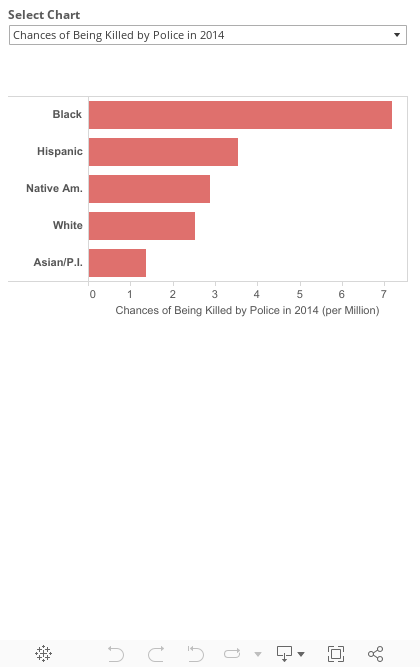
- At least 1175 people were killed by police in 2014. 302 (26%) were Black.
- Black people were killed by police at 2x the rate of their representation in the general population.
- At least 56 unarmed Black people were killed by police, more than all other races combined.
- Police killed at least 14 more Black people in 2014 than in 2012, an increase of 5%. Police killings increased despite a drop in crime.
- Where you live matters. A Black person in St. Louis is 4x more likely to be killed by police than a Black person in New York City. A Black person in Florida is more than 2.5x more likely to be killed by police than a Black person in Georgia.
- It’s not about crime rates. Despite the fact that Newark and St. Louis have similar crime rates and demographics, police killed 3 Black people in St. Louis and zero in Newark in 2014.
- It doesn’t have to be this way. One Black person was killed nationwide in Canada in 2014. There are more Black people in Canada than Missouri.
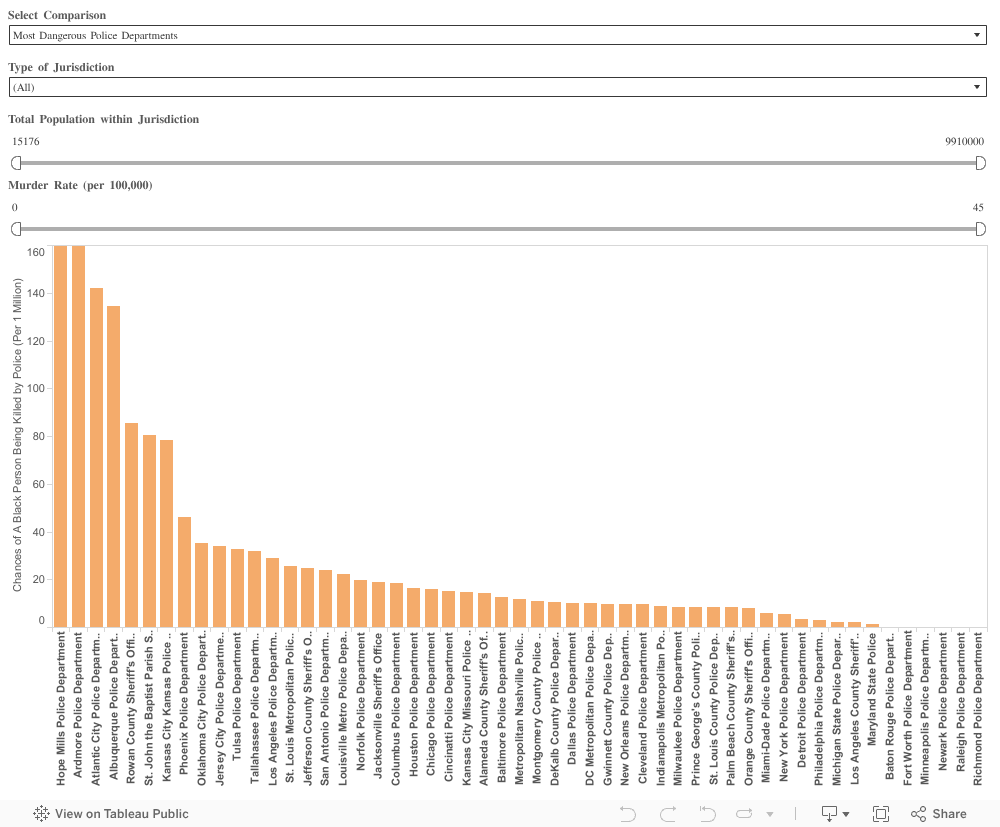
The police departments included in this tool where chosen because they represent jurisdictions with large populations in general and/or large Black populations (Over 50,000). In some cases, police departments were added with jurisdiction over counties, states or small towns because they were responsible for killing two or more Black people in 2014. More police departments will be added over time. Please contact sam@thisisthemovement.org if you would like to add a police department to the chart.
We cannot wait to know the true scale of police violence against our communities. And in a country where at least three people are killed by police every day, we cannot wait for police departments to provide us with these answers. The maps and charts on this site aim to provide us with the answers we need. They include information on 1175 known police killings – including unintentional and off-duty killings as well as in-custody deaths – that occurred in 2014 (There may be killings that did not get reported by the media and, as a result, did not get included in this database). Of these, over 90 percent of the killings occurred while a police officer was acting in a law enforcement capacity. Importantly, these data do not include killings by vigilantes or security guards who are not off-duty police officers.
This information has been meticulously sourced from the three largest, most comprehensive and impartial crowdsourced databases on police killings in the country: FatalEncounters.org, the U.S. Police Shootings Database and KilledbyPolice.net. We’ve also done extensive original research to further improve the quality and completeness of the data; searching social media, obituaries, police reports and other sources to identify the race of close to 90 percent of all victims in the database. Taken together, we believe the data represented on this site is the most comprehensive accounting of people killed by police for the year 2014. We hope these data will be used to provide greater transparency and accountability for police departments as part of the ongoing campaign to end police violence in our communities.
This piece was reprinted by EmpathyEducates with permission. We thank ThisIsTheMovement and ConnectedForJustice, DeRay, Netta, De, and all those on the ground in Ferguson for their kindness, and enduring commitment. If you have any questions/comments or want to submit content, please contact deray@thisisthemovement.org or netta@thisisthemovement.org.